Navigation:
Synergy Outputs > Viewing Sensor Data > Graphical Data >> Graph View Live Data
Graph View Live Data

Contents
The current Live Data for the selected sensor/transmitter is shown the foot of the Graph window. See Figure 556 below:
Figure 556
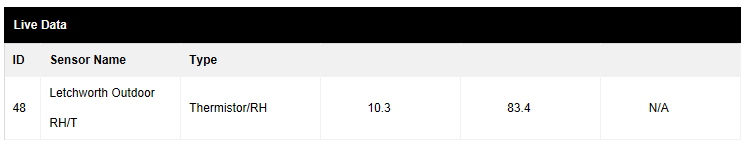
•The data is displayed in columns and is shown in the order that the units are displayed in the Type column.
•In this example, with an entry of Thermistor/RH in the Type column, 10.3 represents temperature and 83.4 represents RH.
•Columns can contain data from different sensor types.