Contents
This section will guide you through all aspects of viewing Sensor/Transmitter data.
To View Sensor Data for a Site
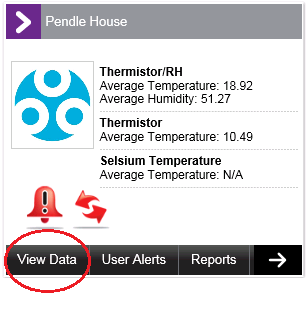
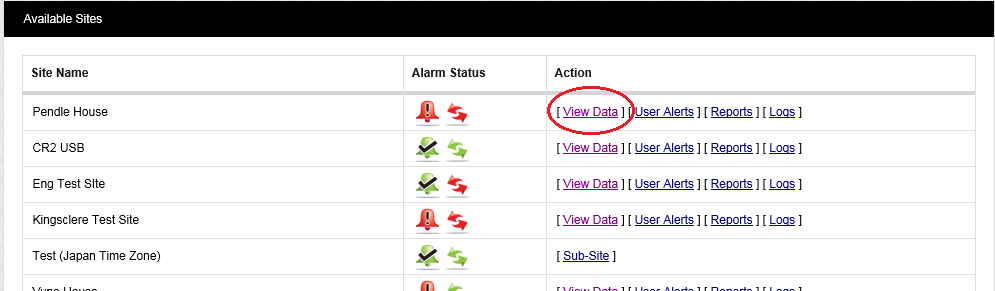
1.From the Dashboard, click on View Data.
•From either the Site's Dashboard icon:
•Or the Text View:
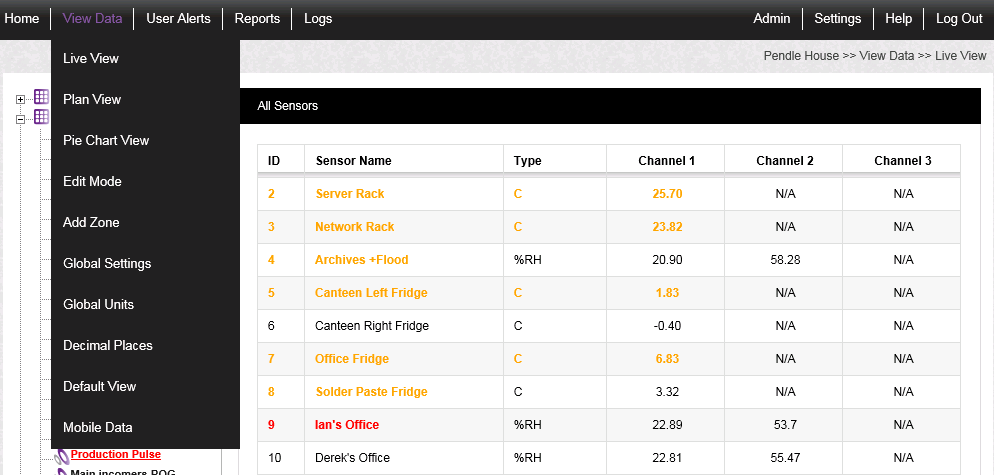
2.Select View Data on the left-hand side of the top menu bar. See Figure 469 below:
Figure 469

•From the drop down menu, you have a choice of three data viewing options:
To view Live Data from a Zone's sensors:
i.Click on the required Zone's name in the left-hand Zone list.
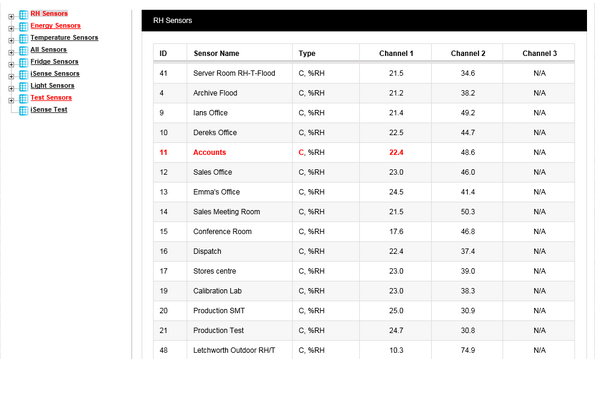
ii.Click on Live View from the drop down menu to access the Live View Table showing all of the Sensors associated with the selected Zone. See Figure 470 below:
Figure 470
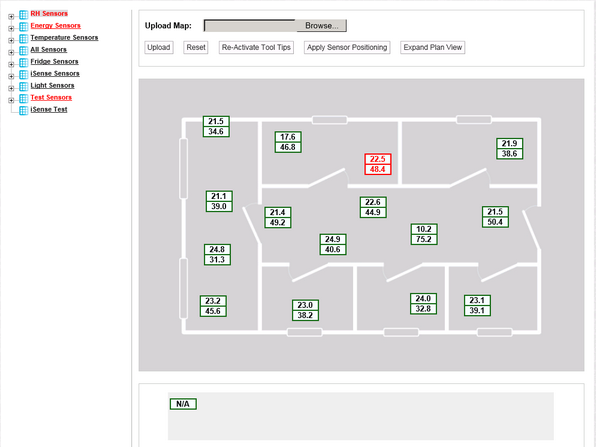
To access a Plan View of a Zone's sensors:
i.Click on the required Zone's name in the left-hand Zone list.
ii.Click on Plan View from the drop down menu to show the location of Sensors associated with the selected Zone on a plan view of the Zone. See Figure 471 below:
Figure 471
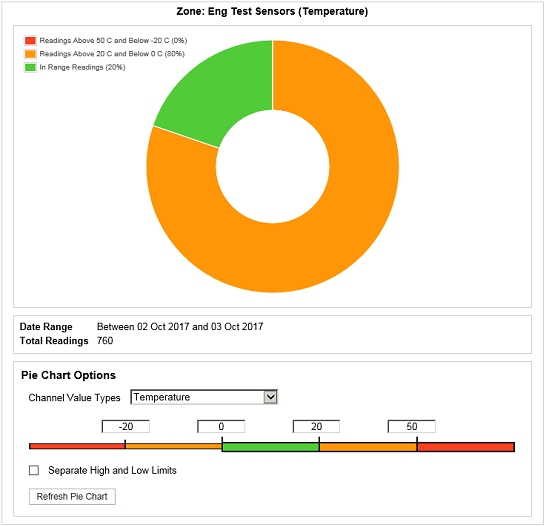
To access a Pie Chart of sensor readings:
i.Click on the required Zone's name in the left-hand Zone list.
ii.Click on Pie Chart View from the drop-down menu to display a pie chart, showing the percentage of sensor readings, associated with the selected Zone, that are within or outside pre-defined ranges of values. See Figure 472 below:
Figure 472
By default, when first clicking on either Live View, Plan View or Pie Chart View, the Sensors associated with the Zone at the top of the left-hand Zone List will be shown and the tree listing the Zones will be collapsed.
2.Click on the Underlined Zone name in the left-hand menu to select the Zone that you wish to view Sensor data on.
•If Live View was selected, a table of Sensors associated with the Zone will be shown. See Figure 470 above.
•If Plan View was selected, a plan view of the Zone will be displayed, showing the location of the Sensors associated with the Zone. See Figure 471 above.
•If Pie Chart View was selected, a pie chart will be displayed, showing the percentage of sensor readings, associated with the selected Zone, that are within or outside a pre-defined range of values. See Figure 472 above.
In Live View, you can sort the displayed Sensor record for the selected Zone by clicking the ID or Sensor Name headings once or twice to sort the Sensors, in ascending or descending order, alphabetically (Sensor Name) or numerically (ID).
3.Click on the + symbol next to the selected Zone's name in the left-hand Zone List to expand the tree and show a list of the selected Zone's associated Sensors. See Figure 473 below:
Figure 473
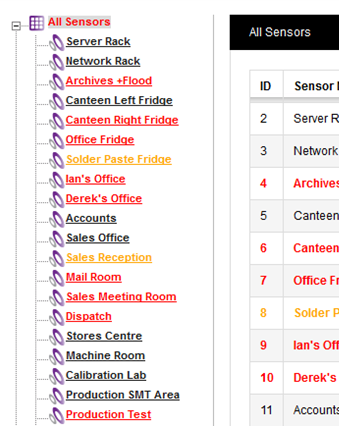
•Notice that in Figure 473 above, the Zone All Sensors is displayed in red. This indicates that at least one Sensor in the Zone has an Alarm activated.
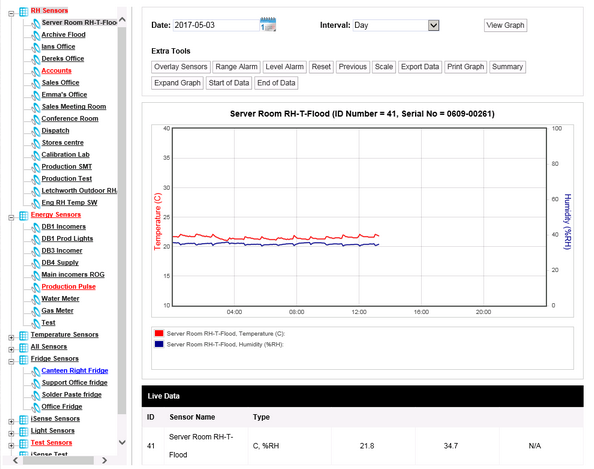
4.In the left-hand menu, click on the Sensor name that you wish to view the Sensor Data for.
•In Live View, Plan View and Pie Chart View, the Live Data View for that Sensor will be displayed. See Figure 474 below for an example of how Live Data is typically displayed.
•Clicking the Sensor Name twice also displays the Sensor's Live Data View.
Figure 474
Sensor Information
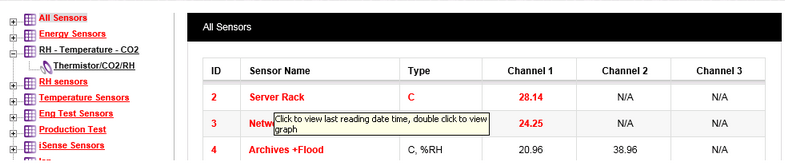
•Letting the mouse pointer hover over a Sensor Name in the Live View Table displays a displays a tooltip of basic instructions. See Figure 475 below:
Figure 475
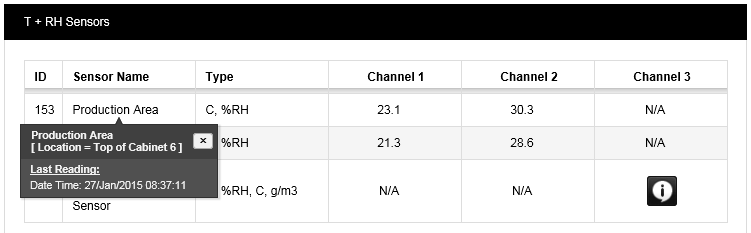
•Clicking the Sensor Name once displays information in a popup window relating to the selected Sensor regarding Location, Alarms, Date and Time, Battery, Sensor Status etc. See Figure 476 below
•Click on the x to close the popup window.
Figure 476
Sensor Information Examples
Example 1:
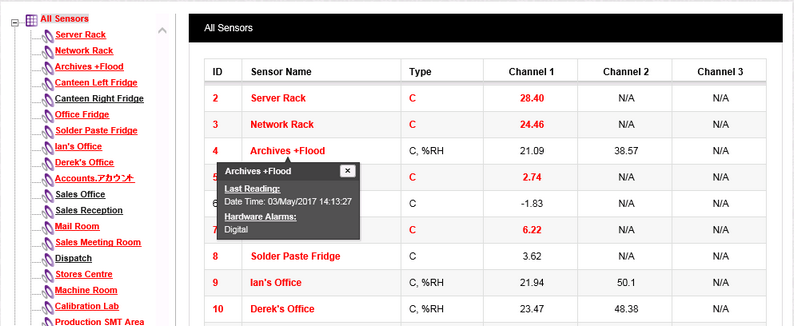
In the example in Figure 477 below, Sensor ID 4's Alarm is activated and its name (Archives + Flood) is therefore highlighted in red in the Live View Table.
•Clicking once on Sensor ID 4's name (Archives + Flood) in the Live View Table has displayed a popup window displaying:
•The time of the last Sensor reading (Last Reading:).
•A warning that there is hmfile_hash_645800bf a Hardware Alarm activated (Digital).
•Since there is only a Hardware Alarm activated, the Channel Alarm column entries are not highlighted in red.
Figure 477
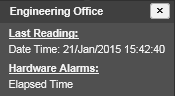
•Clicking once on the Sensor Name for a sensor in the same state could display (for an Elapsed Time Hardware Alarm):
Example 2:
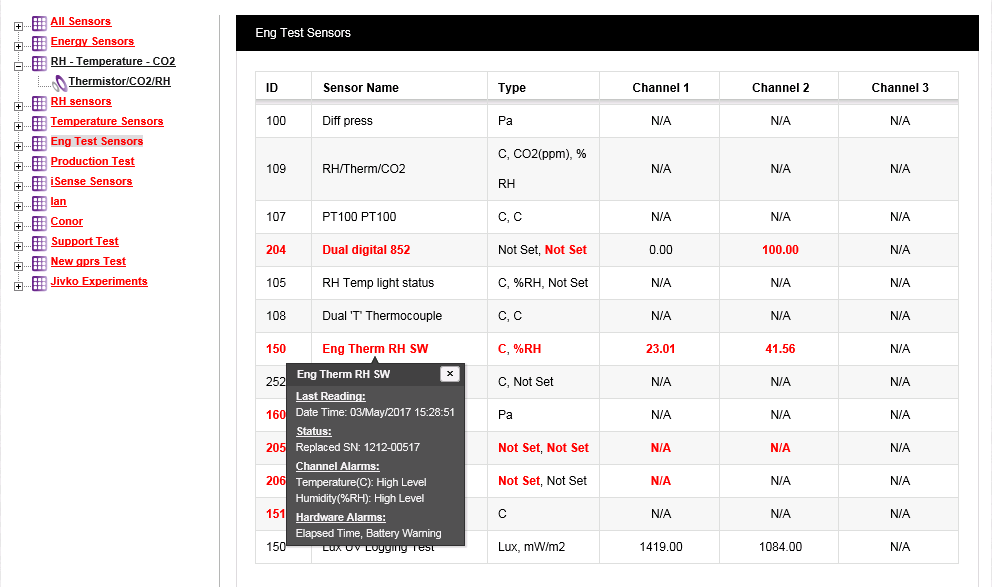
In the example in Figure 478 below Sensor ID 150's Alarm is activated and its name (Eng Therm RH SW) is therefore highlighted in red in the Live View Table.
•Clicking once on Sensor ID 150's name (Eng Therm RH SW) in the Live View Table has displayed a popup window displaying:
•The time of the last Sensor reading (Last Reading:).
• A warning that two Channel Alarms have been activated: Temperature (C) (High Level) for Channel 1 and Humidity (%RH) (High Level) for Channel 2.
•A warning that there is a Hardware Alarm activated (Digital).
As Channel Alarms have been activated for Channel 1 and Channel 2, both values in these columns, for the Sensor ID 150, are highlighted in red.
Figure 478