Contents
A Line graph can be zoomed in on by using the mouse.
To Zoom in on a Section of a Line Graph
1.Place the mouse cursor at the point you want to zoom in on.
2.Click and hold the left mouse button.
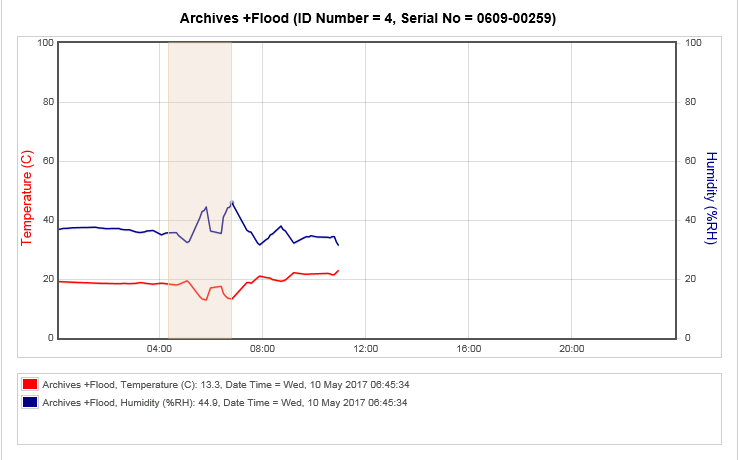
3.Move the mouse to highlight the section of the graph to zoom in on. See Figure 563 below:
Figure 563
4.When the area required has been highlighted, release the left mouse button.
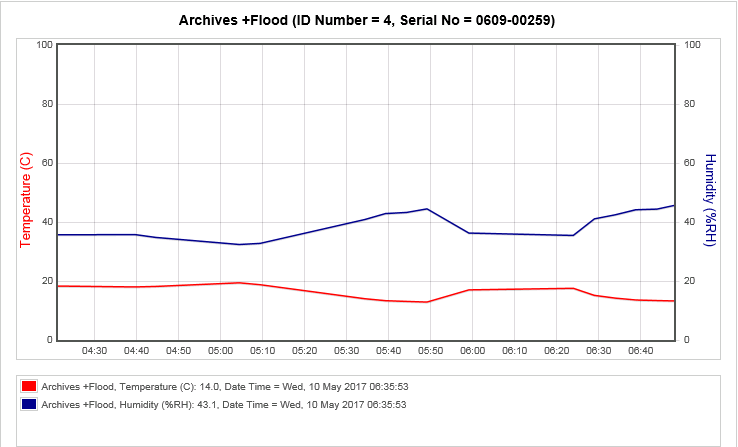
•The graph will re-draw zoomed into the area selected. See Figure 564 below:
Figure 564
•The displayed graph can be zoomed again repeatedly.
Once the graph has been zoomed once, the Zoom Out button will be displayed in the Graph window. See Figure 565 below:
Figure 565
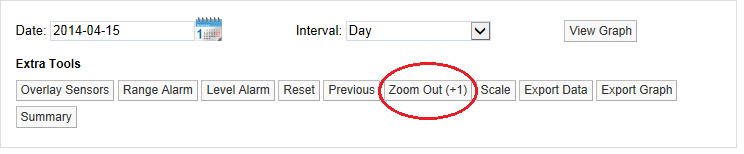
•Clicking on the Zoom Out button zooms the graph out i.e. takes you back one step.
•A number in brackets (+1 in this example) tells you how many times the graph has been zoomed in on; once in this example. If the number in brackets was +3, this would indicate that the graph has been zoomed in on three times.
•To go back to no Zoom in one step you can select Reset.
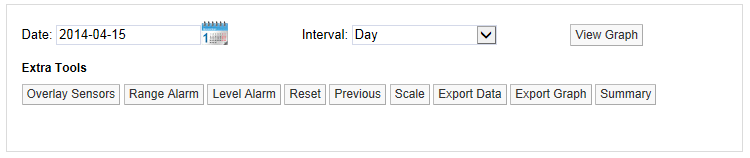
•Once the graph has been returned to an un-zoomed view, the Zoom Out button will disappear. See Figure 566 below:
Figure 566