Navigation:
Synergy Outputs > Viewing Sensor Data > Graphical Data >> Overlay Sensors
Overlay Sensors

Contents
The Overlay Sensors function allows the comparison of one or more sensors.
This function is particularly useful if you have an outdoor Sensor/Transmitter and want to see if the outdoor conditions are driving the conditions indoors.
To Overlay Sensor/Transmitter Data on a Graph
1.Click on the Overlay Sensors button in the Extra Tools section of the Graph window.
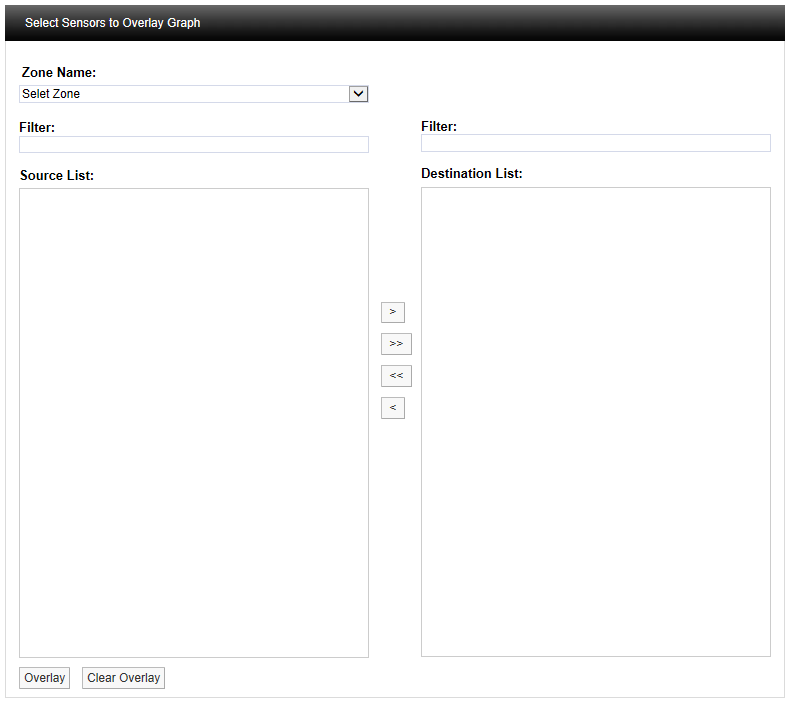
•The Select Sensors to Overlay Graph window is displayed. See Figure 519 below:
Figure 519
2.Select the Zone containing the relevant sensors from the Zone Name: pull-down list. See Figure 520 below:
Figure 520
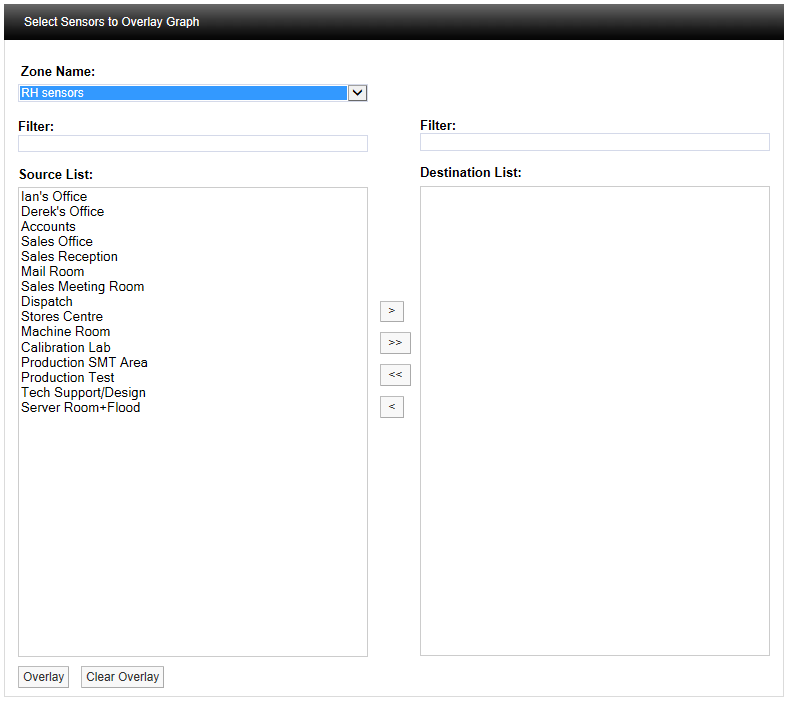
•Sensors associated with the selected Zone will appear in the left hand Source List: panel.
•If there are a large number of Sites/Contacts, the required Site/Contact can be found by using the Filter:.
3.To Add Sensors:
•To add a single Sensor to the Overlay Graph group, select a single Sensor in the Source List: panel and click on the single the right-facing arrow to move the selected Zone's Sensor to the right-hand Destination List: panel.
•Hold down the Ctrl key as you click on the Sensor names to select more than one Sensor.
•To add all of a Zone's Sensors to the Overlay Graph group, click on the double arrow to move all of the selected Zone's Sensors to the right-hand Destination List: panel.
| Note: | Further Zones can be selected from the Zone Name: drop down list and their associated Sensors added to the Destination List: using the procedures above. |
To Remove Contacts:
•To remove a single Sensor from the Overlay Graph group, select a single Sensor in the Destination List: panel and click on the single left-facing arrow to move the selected Sensor to the Source List:
•To remove all Contacts from the Overlay Graph group, click on the double left facing arrow to move all of the group's Contacts to the Source: list.
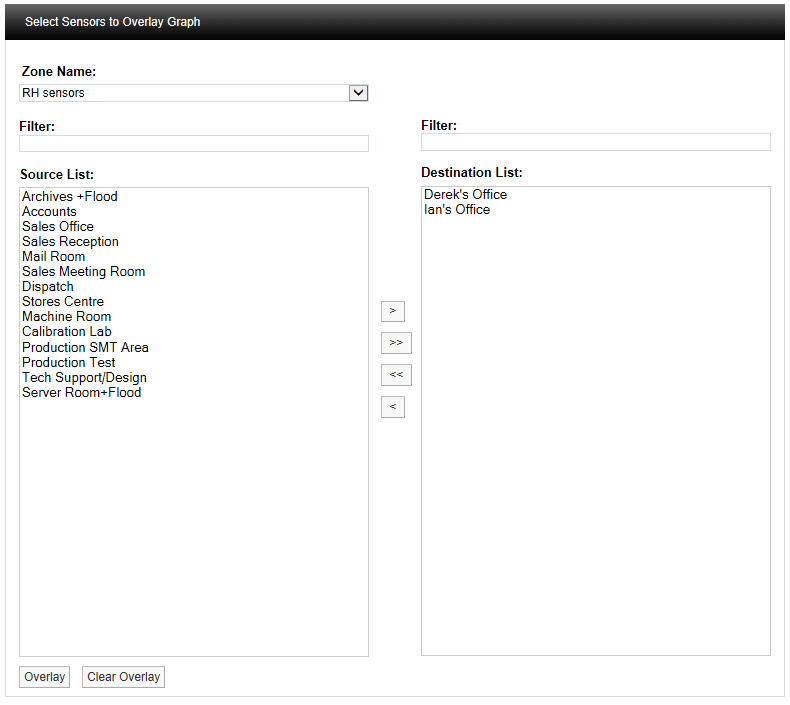
See Figure 521 below:
Figure 521
4.Once you are happy with your selection, scroll to the bottom of the window and click on Overlay. See Figure 522 below.
Figure 522

•After selecting Overlay, you will be asked to confirm your selection. See Figure 523 below:
Figure 523
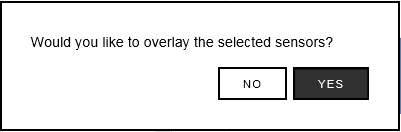
5.Click on Yes to confirm and to proceed with overlaying data on the graph.
Click on No to cancel the overlay.
•An updated graph window will be displayed, with the selected Sensor/Transmitter data overlaid over the original graph. See Figure 524 below:
Figure 524
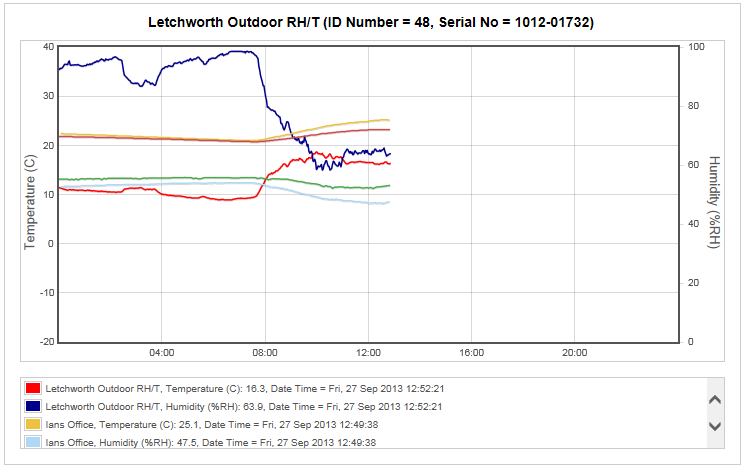
The coloured Key below the graph window clearly identifies the overlaid data traces.
•Use the scroll bars to the right of the Key to view information on all of the represented Senor/Transmitter data.
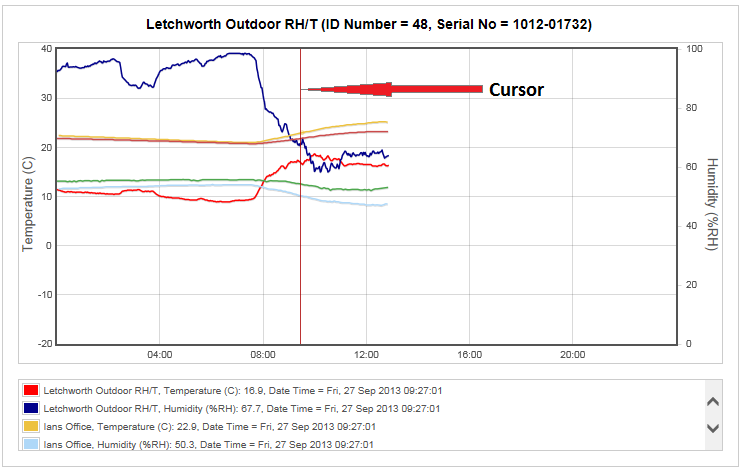
To view specific values on the graph a cursor can be applied to the graph.
•Move the mouse pointer over the graph window to display the cursor. See Figure 525 below.
•If you keep the mouse pointer within the graph window, moving the mouse pointer to the left and right will move the cursor across the screen, changing the Sensor/Transmitter data values displayed in the Key as the date and time change.
Figure 525
•To remove the overlay:
i.Select the Overlay Sensors button to display the Select Sensors to Overlay Graph window.
ii.Scroll to the bottom of the Source List: and select Clear Overlay.
•The graph is returned to displaying the original data. See Figure 526 below.
Figure 526

Example:
In the example shown in Figure 526 above; as the outside temperature (red trace) increases, the two indoor temperature traces (salmon and mustard coloured) also increase. This indicates that the equipment controlling the indoor space is not powerful enough to overcome the effects of the outside temperature changes.