
Contents
The configuration of a graph's Scale can be selected by the User.
To Change the Scale
1.Click on the Scale button in the Extra Tools section of the Graph window to display the Graph Scale window. See Figure 544 below:
Figure 544
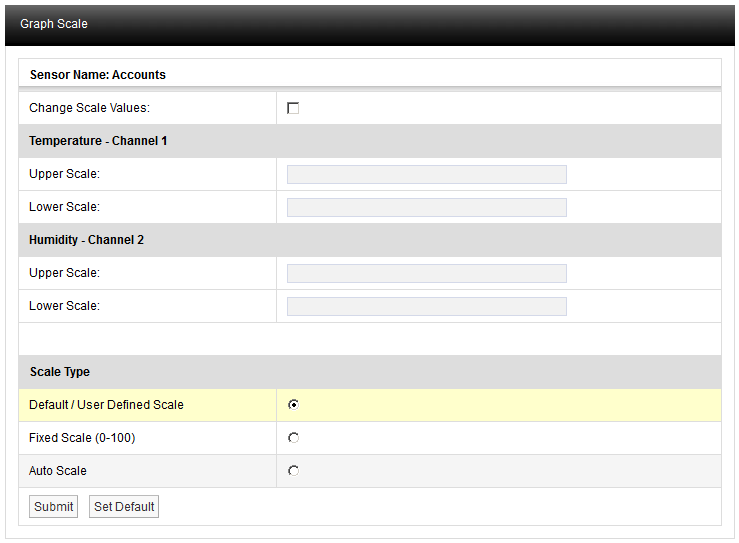
2.Select from the options available in the Graph Scale window:
•Change Scale Values
By checking this check box you can enter upper and lower scale values and update them by clicking Submit.
•Scale Type
Select the Scale Type you require by clicking the option button next to the Scale type required:
•Default/User Defined Scale
You can define a default Scale for each Sensor/Transmitter on the system. The User Defined Scale can be set in the Calibration page see section 6.3.3. Some Sensor/Transmitters have a very wide operating range but the Sensor/Transmitter in question may be being used at one end of the range. A User Defined Scale allows a more detailed view of the data.
•Fixed Scale (0-100)
Each Sensor/Transmitter installs with a Default Scale which would cover the maximum range for that Sensor/Transmitter. This is Scale setting is OK if the Sensor/Transmitter is going to be used over its range if it’s to be used over a smaller range then a User Defined Scale may be more appropriate, see above.
•Auto Scale
This feature allows the graph Scale to be set automatically, Auto Scale will set the graph Scale to a very tight range which covers the range for the data displayed. This gives a much expanded view of the data and may confuse as the data can look like it is changing dramatically.
3.Select Submit.
•Default scale values can be applied by clicking on the Set Default button.
•The graph will re-draw with the new Scale settings, see Figure 545 below for an example:
Figure 545
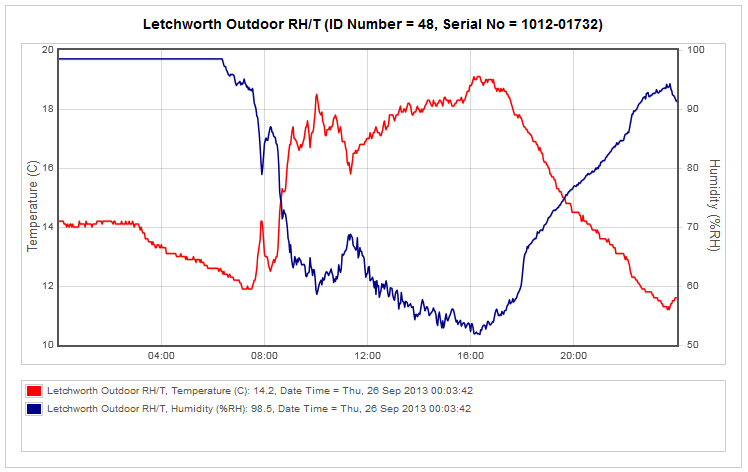
The User Defined Scale for this Sensor/Transmitter is -20°C to +40°C (Temperature) and 0% to 100% (Relative Humidity). Using Auto Scale has rescaled the graph to 10°C to 22°C and 50% to 100% RH.