Navigation:
Synergy Outputs > Viewing Sensor Data > Graphical Data >> Start Date and Interval
Start Date and Interval

Contents
•A graph's Start Date is the date that the graph will start from.
•A graph's Interval is the date range of the data displayed on the graph.
•The Graph window defaults to displaying the current day’s data.
To Change the Start Date for the Graph's Time Period
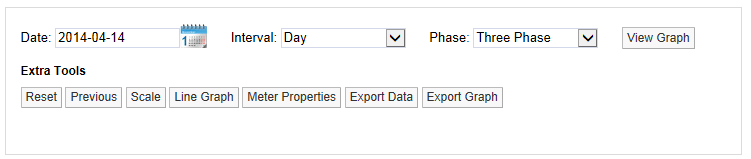
•In the Date: field at the top left of the Graph window. See Figure 514 below:
Figure 514
Either:
Click on the calendar icon to select a Start date.
Or:
Manually enter a Start date into the Date: box in the form: yyyy-mm-dd.
•See Figure 515 below:
Figure 515
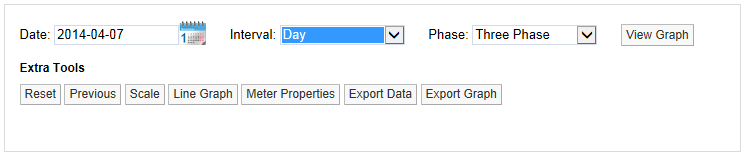
•In this example, the start date has been changed to the 7th April 2014.
To Change the Data Interval
To change the Data Interval displayed on a graph:
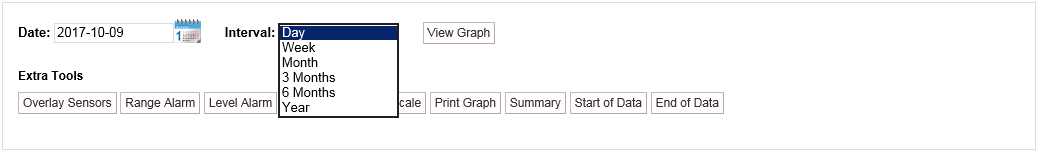
1.Select Day, Week, Month, 3 Months, 6 Months or Year from the Interval: drop down list at the top of the Graph window. See Figure 516 below:
Figure 516
•To view data for an interval of a Week, enter, or select from the calendar, a date that is a week or more prior to the current date.
•To view data for an interval of a Month, enter, or select from the calendar, a date that is a month or more prior to the current date.
•Similarly, to view data for intervals of 3 Months, 6 Months or a Year, select dates from the calendar that are, respectively, 3 months or more, 6 months or more or a year or more prior to the current date.
2.Click on View Graph.
•The graph is displayed for data over the chosen Data Interval and from Start Date.
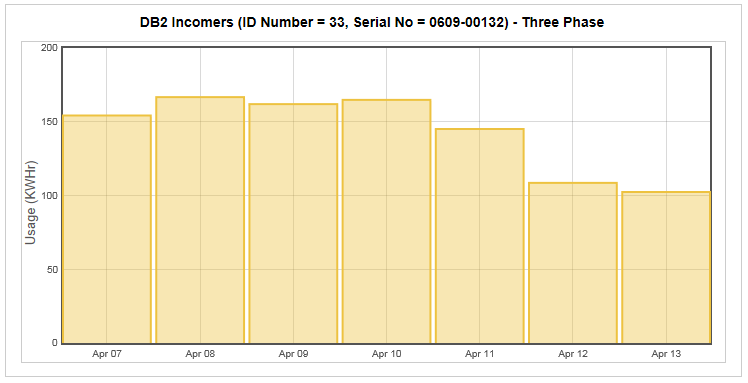
For an example of data with a Start Date of 7th April and an Interval of a week. See Figure 517 below:
Figure 517
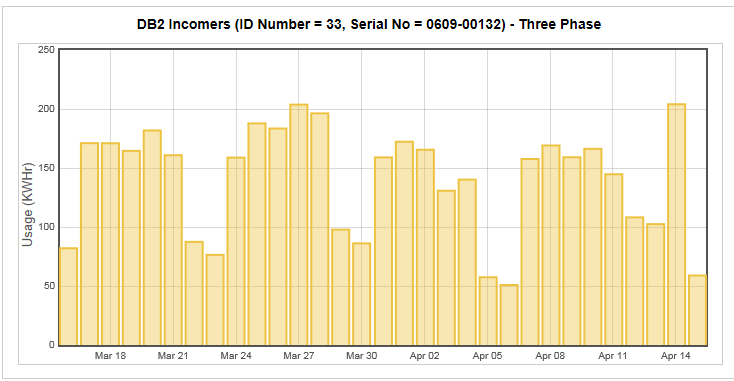
For an example of data with a Start Date of 16th March and an Interval of a Month. See Figure 518 below:
Figure 518
Click on View Graph to generate the graph with the selected parameters applied.