
Contents
The data associated with Day and Week interval graphs can be exported to a Comma Separated Variables (.CSV) file.
•The entire Day or Week’s data will be exported, irrespective of the current Zoom state when the data is exported.
To Export Data
Click on the Export Data button in the Graph window. See Figure 550 below:
Figure 550
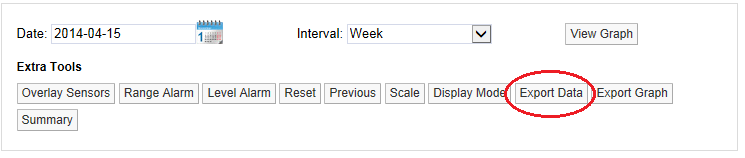
| Note: | The Export Data button can appear under the Overlay Sensors button or to the right of the Display Mode button, this is normal and depends on graph view, browser, screen width, etc. |
•Once you click on the Export Data button you may be asked to choose between saving the file and opening with your computers default spread sheet application. See Figure 551 below:
Figure 551
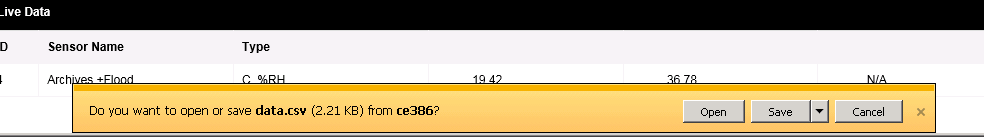
| Note: | The exact action will depend on the Browser you are using; the default settings you have made for your Browser; the computer operating system and its set-up; and any spread sheet application you may have installed on your computer. |
•If you require assistance with this contact your System Administrator or IT support provider, please do NOT contact IMC Technical Support, as this is help that only your Administrator/Support provider can supply.