
Contents
The Range Alarm feature allows the High Range Alarm and Low Range Alarm levels to be overlaid on a graph.
To use this feature, Range Alarm levels will first need to be set.
•See the Alarms section for information on how to set alarms.
To Overlay Range Alarm Levels on a Graph
1.Click on the Range Alarm button in the Extra Tools section of the Graph window.
•The Select Channel to Display Range Alarm Settings window is displayed. See Figure 527 below:
Figure 527
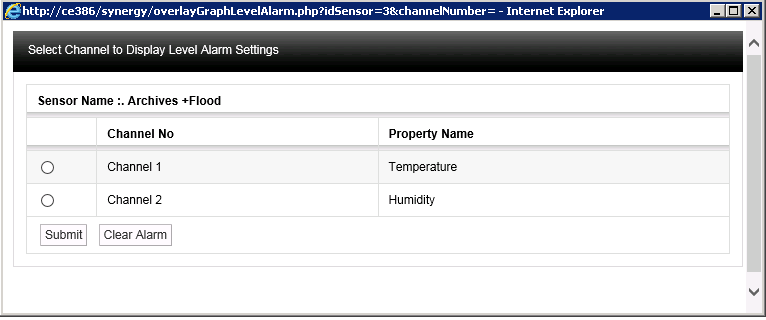
2.In this example, to overlay the upper and lower Temperature Range Alarms, select the option button next to Channel 1 and select Submit.
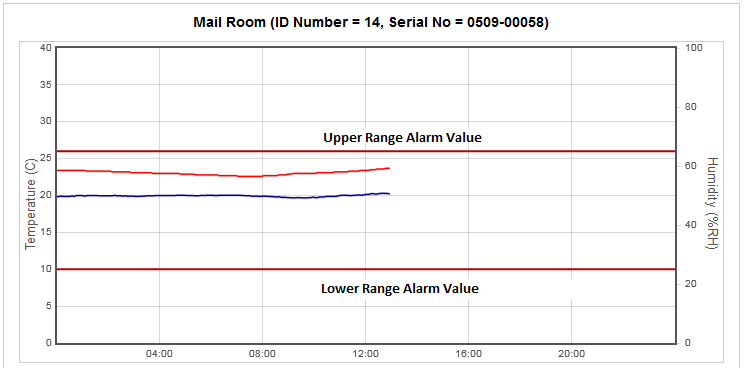
•Lines representing the upper and lower Range Alarm values will appear on the graph, giving a clear visual indication of whether there has been an excursion either above or below the upper or lower Range Alarm settings. See Figure 528 below.
Figure 528
To Clear Range Alarm Overlay from a Graph
1.Select Range Alarm from the Graph window to display the Select Channel to Display Range Alarm Settings window See Figure 527 above.
•The Range Alarm overlay on the graph will be highlighted.
2.Select Clear Range Alarms.
•The Range Alarm overlay will be removed from the graph.