
Contents
Synergy has been designed to be able to accommodate Custom Plug-in Reports of information generated from, and related to, the System's Sensor/Transmitters.
•The reports can be tailored to the Customer’s individual specifications and generated at the click of an on-screen button in PDF format, with the option to have a .CSV data file attached.
Additionally, User Configurable Scheduled Reports can be generated and, once configured, be auto-generated on a daily, weekly or monthly basis and sent to the User by email.
•Scheduled Reports can be downloaded and saved in PDF format.
Your Company Logo can be automatically added to any standard (PDF or RTF) report.
Generating Reports
Synergy's Report functionality is accessed via the Reports menu on the main menu bar. See Figure 613 below.
Figure 613
![]()
Four types of Report are available:
Summary Reports (Reports>Browser Summary Reports)
Two types of Summary Report can be generated - Sensor Reports and Zone Reports.
•Sensor Reports - Summaries of data collected by a selected Sensor or Sensors (temperature for a Temperature Sensor, current for an Energy Sensor etc.) for a specified date range (the past week by default).
•Zone Reports - Summaries of data collected by all Sensors in a given Zone for a specified date range.
To Generate a Summary Report:
1.Select Browser Summary Reports from the Reports menu to display the Browser Summary Report Window. See Figure 614 below:
Figure 614
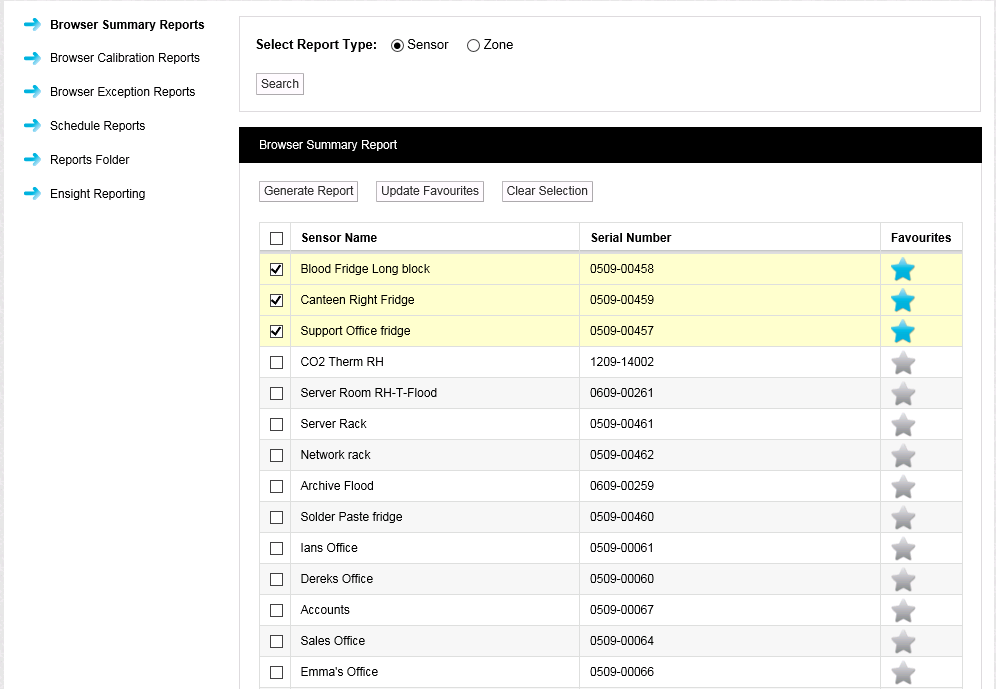
•By default a list of Sensors associated with the System are displayed. To display, and generate Summary Reports for, Zones, check the Zone radio button and then click on the Search button.
2.Select Sensor or Zone.
Either:
Select individual Sensors/Zones by ticking the relevant checkboxes.
Or:
Select all Sensors/Zones by ticking the check box adjacent to the Sensor Name or Zone Name column heading.
3.Click on the Generate Report button.
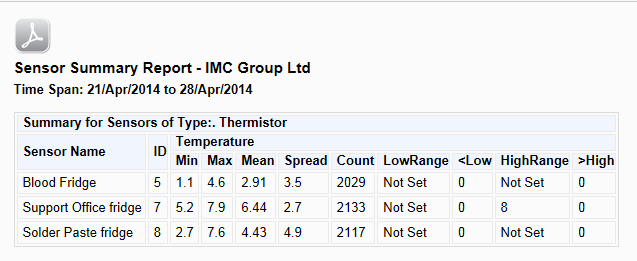
•A Summary Report for the selected Sensors/Zones is generated and displayed. See Figures 615 and 616 below:
Figure 615
Sensor Summary Report
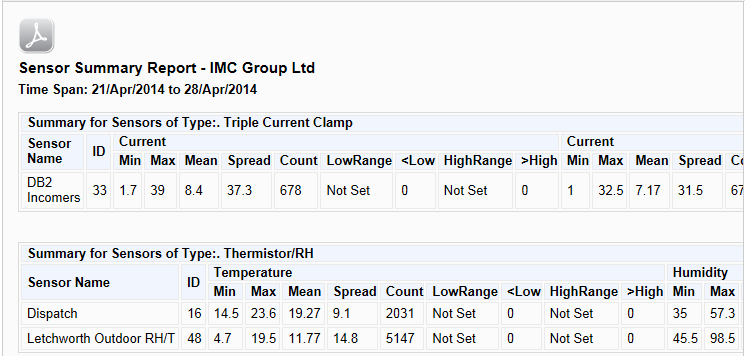
Figure 616
Zone Summary Report
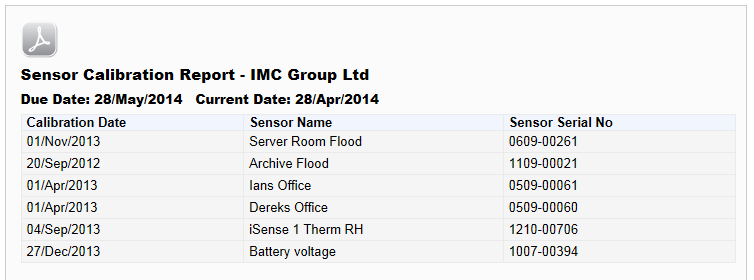
Calibration Reports (Reports > Browser Calibration Reports)
A simple report of sensors that need calibrating on, or before, a given date (one month from today’s date by default).
For example:
Figure 617
To Generate a Calibration Report:
1.Select Browser Calibration Reports from the Reports menu to display the following window. See Figure 618 below:
Figure 618
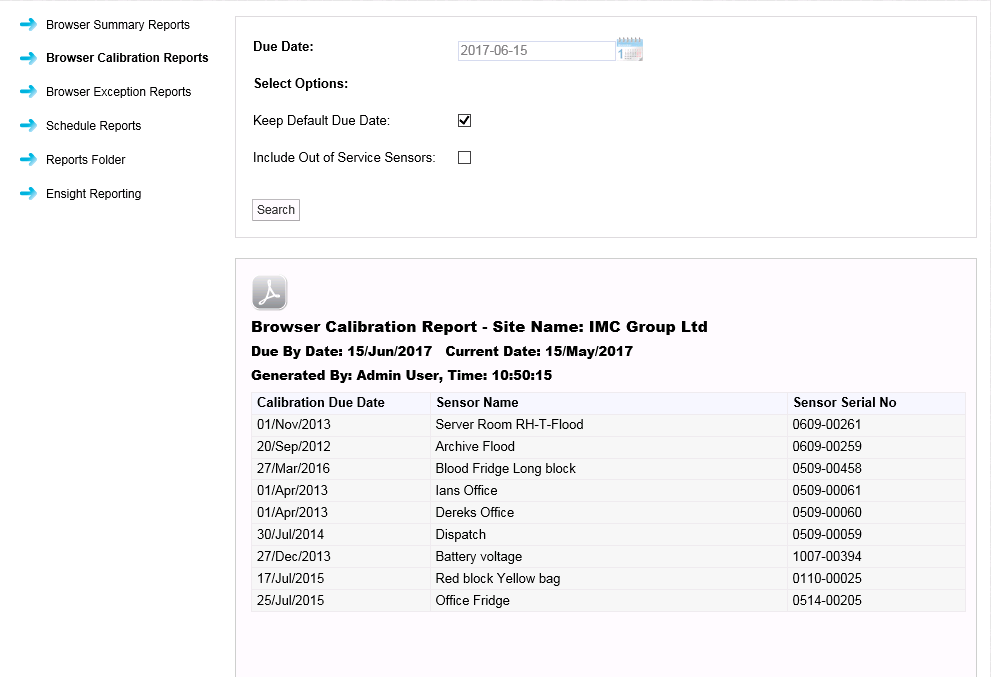
•A previously generated Browser Calibration Report may also be displayed.
2.Tick or untick the Include Out of Service Sensors: checkbox to include or exclude out of service sensors from the Calibration Report.
3.Either:
Tick the Keep Default Due Date: checkbox under Select Options:
Or:
Select or enter (in the format yyyy-mm-dd) a date by which Sensors are due for calibration from the Due Date: calender or dialog box.
4.Click on the Search button.
•A Browser Calibration Report is generated.
Exception Reports (Reports>Browser Exception Reports)
Reports ongoing alarm conditions, by Sensor or by Zone.
To Generate an Exception Report:
2.Select Browser Exception Reports from the Reports menu to display the Browser Exception Report window. See Figure 619 below:
Figure 619
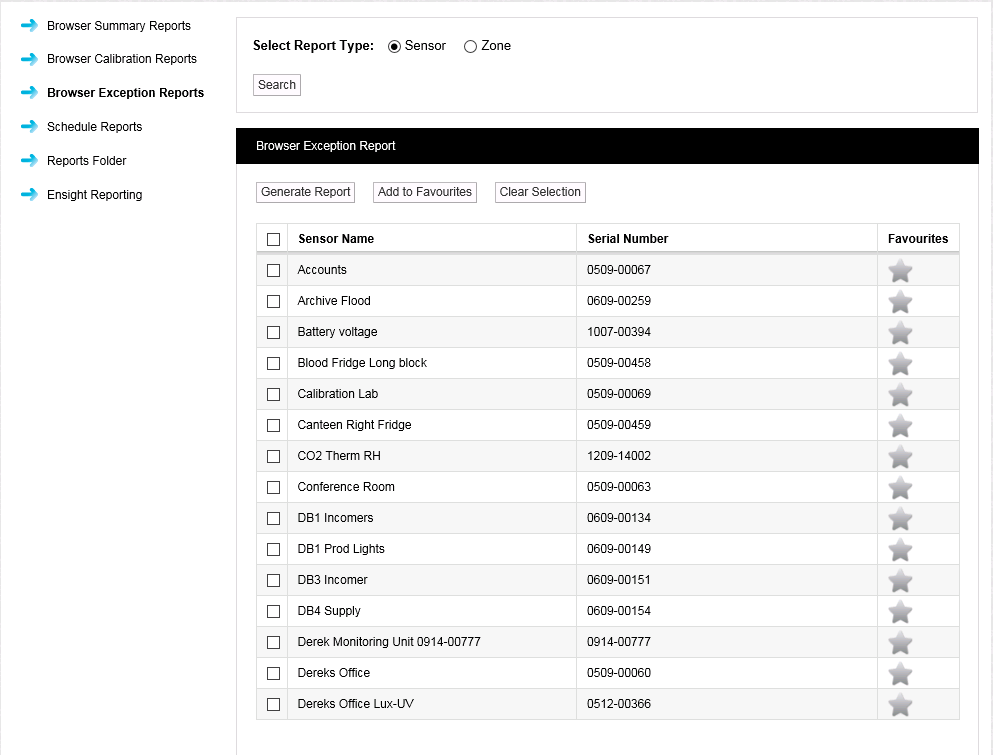
•By default a list of Sensors associated with the System are displayed. To display, and generate Exception Reports for, Zones, check the Zone radio button and then click on the Search button.
3.Select Sensor or Zone.
Either:
Select individual Sensors/Zones by ticking the relevant checkboxes.
Or:
Select all Sensors/Zones by ticking the check box adjacent to the Sensor Name or Zone Name column heading.
4.Click on the Generate Report button.
•An Exception Report for the selected Sensors/Zones is generated and displayed. See Figure 620 below:
Figure 620
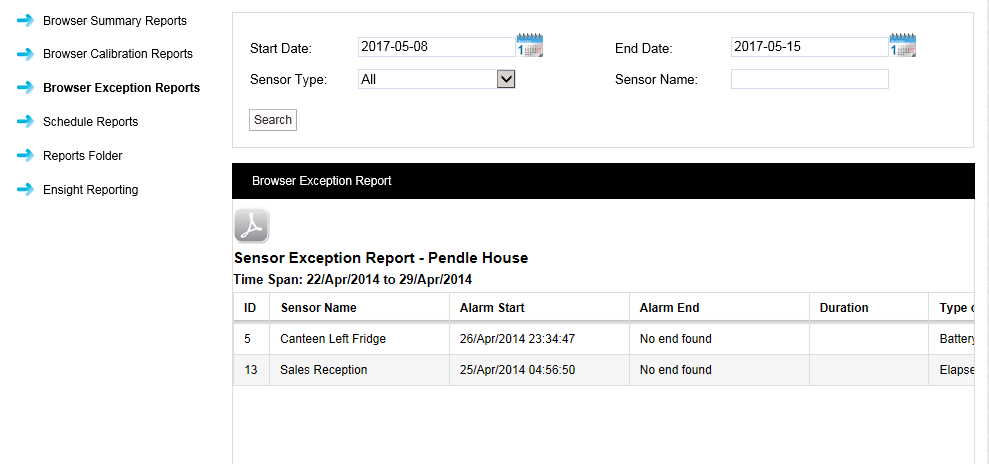
•Search functionality is provided at the top of this window, enabling Exception Reports to be generated within specific parameters:
To generate an Exception Report within specific parameters, enter the following values:
•Start Date and End Date
Either:
Select a Start Date or End Date from Start Date: and/or End Date: calender.
Or:
Enter (in the format yyyy-mm-dd) a Start Date and/or End Date into Start Date: and/or End Date: dialog boxes.
•Sensor Type
Select a Sensor type from the Sensor Type: drop-down list.
•Sensor Name
Type a Sensor name into the Sensor Name: dialog box.
Click on the Search button.
Scheduled Reports (Reports > Schedule Reports)
These cover a variety of Report types, including Summary and Exception reports, which can be set up to start at a pre-defined date/time and can run at pre-defined intervals.
To Add Scheduled Report Settings:
1.Select Schedule Reports from the Reports menu to display the Add Scheduled Report Settings window. See Figure 621 below:
Figure 621
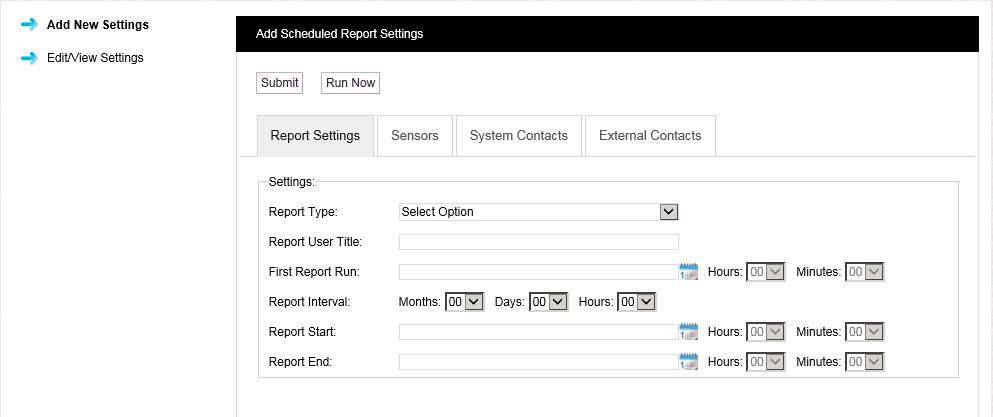
2.Select the required Scheduled Report Type from the Report Type: drop-down list in the Report Settings section of the window.
3.Enter a title for the new report into the Report User Title: field.
4.Define the Scheduling for the Report using the First Report Run:, Report Interval:, Report Start:, Report Start: and Report End: fields, associated Hours and Minutes drop-downs and Calendar popups. See Figure 621 above.
➢First Report Run
Select a date and time for the first Report run using the First Report Run: controls.
This should be later today or any time in the future.
➢Report Interval
Report Interval defines the length of time between repeated runs of the Report. For example, an interval of one day would give daily Reports.
You don’t have to specify a Report Interval; if you don't, this would give a ‘one off’ Report.
➢Report Start/Report End
Use the Report Start: and Report End: controls to specify the time span for the Report.
This would typically be dates in the past, but could be dates in the future; although if, for example, you specified a start date one week in the future and end date two weeks in the future you would have to wait 2 weeks before you saw a Report.
| Note: | You should Either: Set an Interval, with no Report Start or Report End time. Or: Set Report Start and Report End times with no Interval. |
5.Either: Click on the Submit button to create the Schedule and run it from the defined date/time at the defined interval.
Or: Click the Run Now button to run the selected report straight away.
Scheduled Reports are saved to the Reports Folder.
| Note: | Some delay can be expected if a large report is submitted. |
| Note: | If your Email Server has been set up to limit the maximum allowed email/attachment size, then Scheduled Reports in excess of the size limit will be blocked by your Email Server. Please note that because there is no standard mechanism for feeding this eventuality back to the email client, Synergy cannot know that these emails have been blocked by the server. Most Email Servers inform the sender of this situation by placing a message in the sender account's Inbox. |
If Scheduled email Reports are not being sent, please check the Inbox for the sender account you setup in Synergy.
Adding Your Company Logo to Standard (PDF or RTF) Reports
Synergy can be configured to display your Company's Logo on standard reports, when they are generated by Synergy, by using the SynergyConfiguration Tool as follows:
| Note: | Custom Reports Logos will only appear on Scheduled PDF or RTF Reports; Custom Reports Logos will not appear in CSV or Browser Reports. |
1.Start the SynergyConfiguration Tool by selecting it's entry in the Start menu.
•A series of windows will be shown as the SynergyConfiguration Tools load.
•The exact windows shown will depend on the OS of the machine Synergy is running on; examples are shown below:
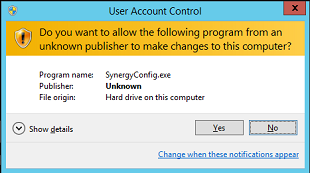
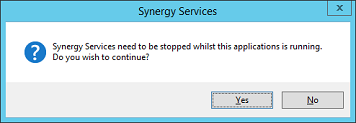
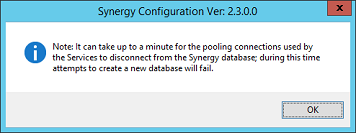
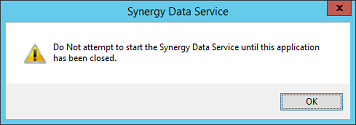
2.Click on Yes or OK on the displayed windows to accept each stage of the SynergyConfiguration Tools start-up.
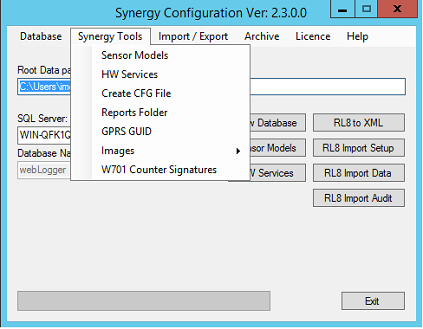
3.Select Synergy Tools from the menu bar on the displayed SynergyConfiguration Ver: X.X.x.x window. See Figure 622 below:
Figure 622
4.Select Images from the drop down menu. See Figure 623 below:
Figure 623
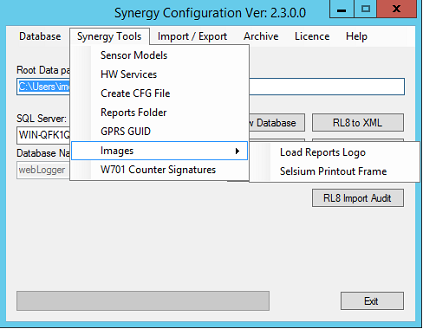
5.Select Load Reports Logo from the displayed sub-menu.
•An Open window is displayed from which you can navigate to the location of the required image. See Figure 624 below:
Figure 624
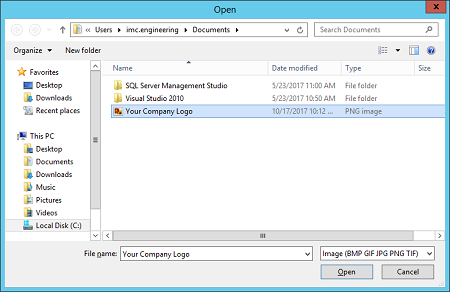
6.Select the required company logo image and click on Open.
•The Reports Logo window is displayed with a preview of the selected Company Logo. See Figure 625 below:
Figure 625
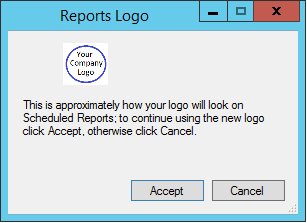
7.If the logo is displayed correctly, click on Accept.
8.Click Exit on the SynergyConfiguration Ver: X.X.x.x window.
From this point onwards, your Company's logo will be displayed on all standard reports as they are generated by Synergy.