Contents
Summary Data is available for most sensor types.
To Display Summary Data for the Selected Time Interval
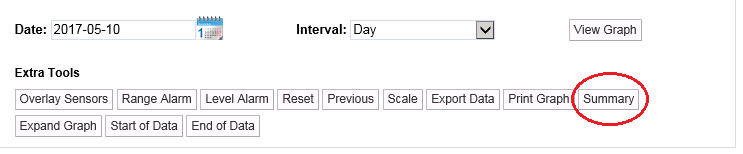
Click on the Summary button in the Graph window. See Figure 557 below:
Figure 557
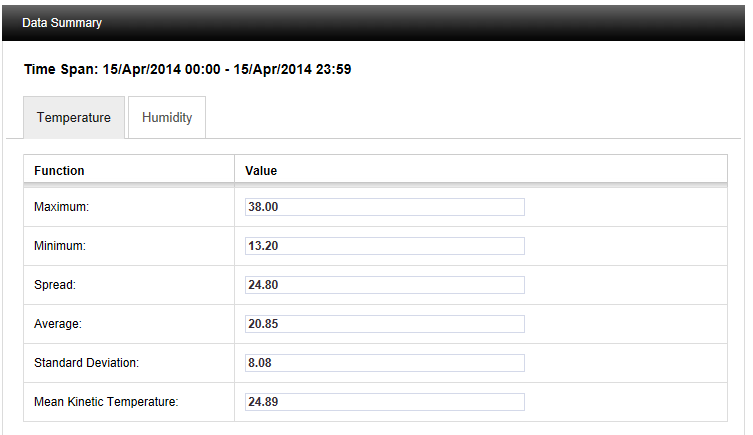
•The Data Summary window is displayed, showing Summary Data for each parameter for the selected Time Interval. See Figure 558 below:
Figure 558
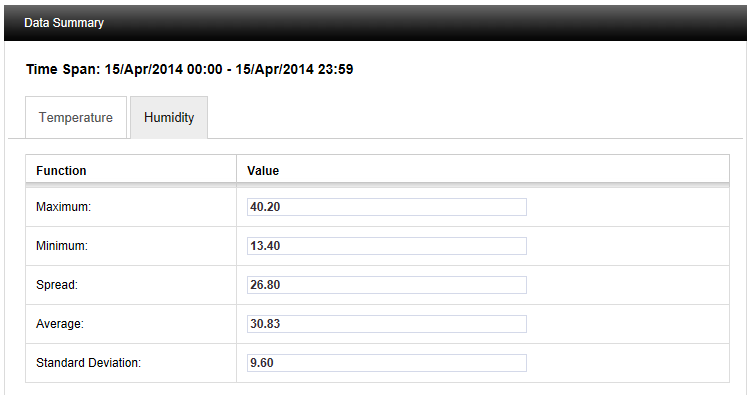
•In this example, clicking the Humidity tab will display Summary Data for the Humidity parameter. See Figure 559 below:
Figure 559
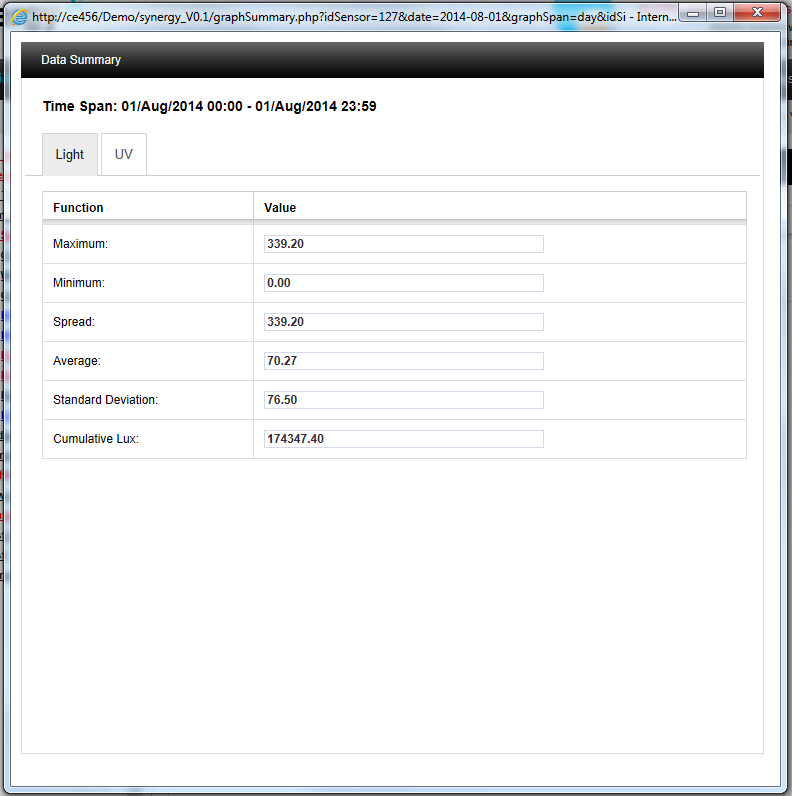
•As another example, a Data Summary window for a Cumulative Lux (light) sensor could be displayed. See Figure 560 below:
Figure 560