Contents
To Display a Graph of a Sensor/Transmitter's Data
Current or Pulse Count Sensor Data
Line Graphs
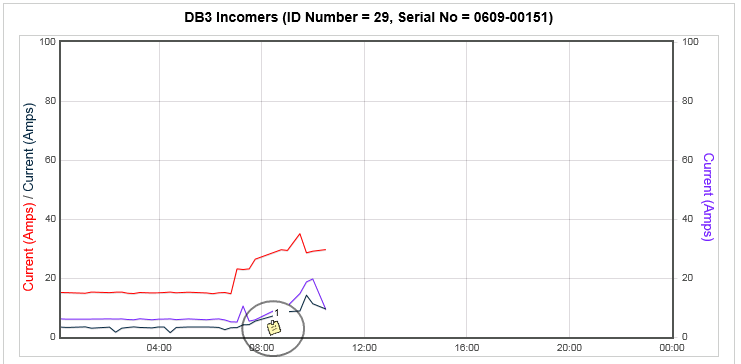
The majority of sensors will display live data in the form of Line Graphs, such as shown in Figure 533 below:
Figure 533
Line Graphs can be annotated with notes as follows:
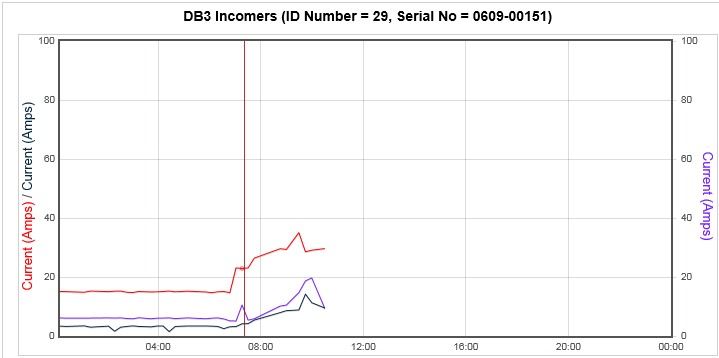
1.Hold the mouse pointer over the point on the graph's line plot that the note will apply to. See Figure 534 below:
Figure 534
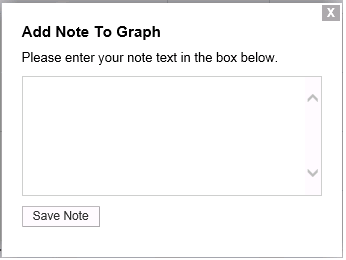
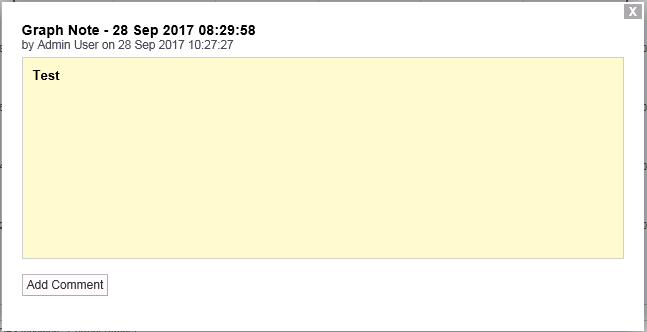
2.Double click the left hand mouse button.
•The Add Note to Graph window is displayed into which you can type notes concerning the highlighted data point. See Figure 535 below:
Figure 535
3.Click on Save Note.
•The note is saved and represented on the Line Graph by an icon. See Figure 536 below:
Figure 536
•Further notes can be added to the graph by repeating steps 1-3 above.
Note: Saved Notes cannot be deleted or edited directly once saved, though Comments can be added to them; see To Add a Comment to a Saved Note below.
To Display a Saved Note:
Click on the required Note Icon on the graph.
•The Graph Note window is displayed showing the saved Note. See Figure 537 below:
Figure 537
To Add a Comment to a Saved Note:
1.Display the Graph Note window as above.
2.Click on Add Comment.
•The Add Comment window is displayed. See Figure 538 below:
Figure 538
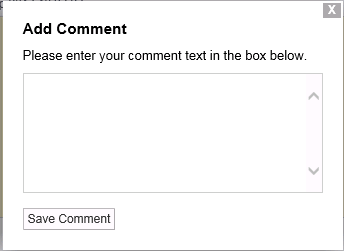
3.Type in the required comment for the note.
4.Click on Save Comment.
•The Graph Note window is displayed again with the new comment added. See Figure 539 below:
Figure 539
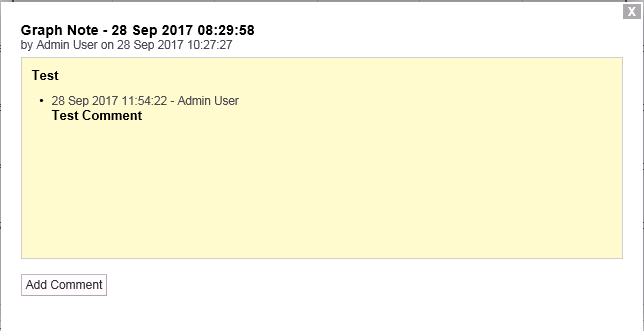
•Further comments can be added to the note by clicking on Add Comment again.
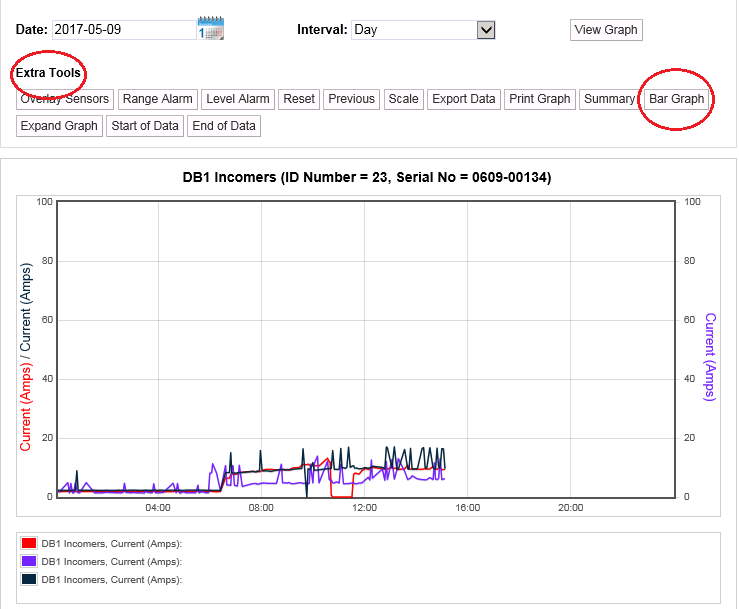
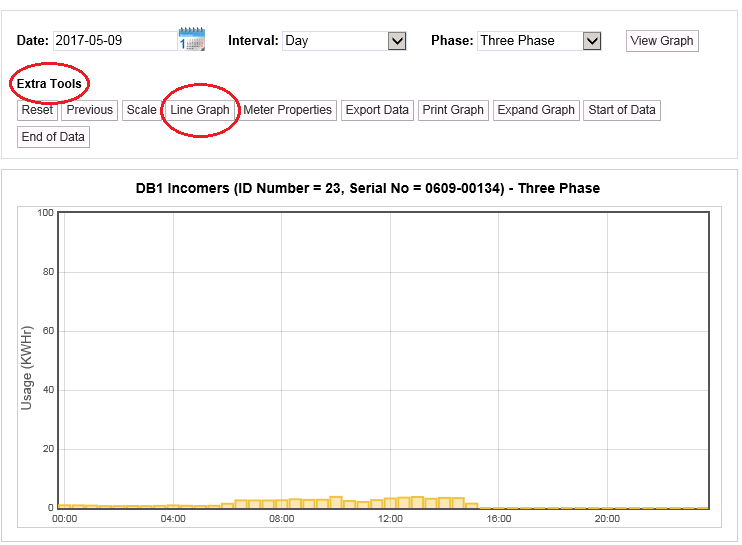
Current or Pulse Count Sensor Data
By default, a Current or Pulse Count sensor's data is displayed as a Utilities Bar Chart in the Graph window.
•To view a Current or Pulse Count sensor's data as a Line Graph, click on the Line Graph button in the Extra Tools section of the Graph window. See Figure 540 below:
Figure 540
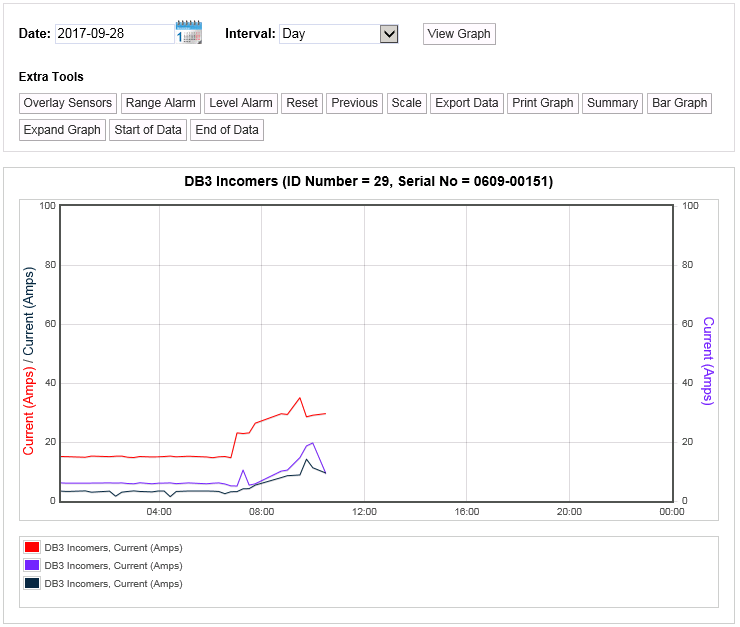
•To return to the Utility Bar Chart view from the Line Chart view:
Either:
Click on the Bar Graph button in the Extra Tools section of the Graph window. See Figure 541 below.
Or:
Click the sensor's icon in the left-hand menu tree.
Figure 541